Learn how to create high-impact annual DAM reports with data-driven insights, ROI metrics, and executive-ready templates that secure next year's resources.
Problem: How do you create an annual DAM report that captures executive attention and secures budget approval?
Solution: The key lies in data transformation, scenario presentation, and value quantification. With MuseDAM's analytics and visualization capabilities, companies can turn abstract concepts like "efficiency gains," "cost savings," and "asset security" into compelling stories backed by numbers that executives instantly understand.
Key Data: Reports must cover three critical dimensions—efficiency, security, and growth—while translating findings into budget-friendly language. For instance, "automated reporting eliminates manual data compilation, equivalent to saving two full-time positions."
For many enterprises, year-end marks the critical budget battleground. Without data backing, DAM platforms risk being viewed as "ordinary tools" rather than "business engines."
An annual DAM report answers:
This isn't just a summary—it's your weapon for securing resources and executive support for the coming year. When leadership asks in budget meetings, "Is this system really worth renewing?" a data-rich, value-clear annual report provides the most powerful answer.
Many companies face these pain points when preparing annual summaries:
Lisa, Creative Director at a multinational beauty brand, once experienced this year-end ordeal: To prepare the annual presentation, her team had to dig through various folders, emails, and chat logs hunting for asset usage data. For two solid weeks, team members worked overtime tracking "which assets were used how many times," "which versions had errors," and "how much time cross-department collaboration consumed."
Ultimately, while the report was completed, data accuracy remained questionable, visualization was mediocre, and management simply nodded without any meaningful resource allocation.
After navigating Singles' Day, Black Friday, and Christmas promotions, a cross-border e-commerce company's Marketing Director urgently needed to demonstrate "asset management system value during peak campaigns" to the CEO. But problems emerged:
The final report could only use vague statements like "efficiency felt improved," completely failing to convince ROI-sensitive executives.
These scenarios share common threads: no unified data source, no automated statistics, and no capability to transform data into business value.
An effective annual report should include at minimum:
Example: "Through MuseDAM, we reduced asset approval time by 40% in 2024, improved cross-department collaboration efficiency by 35%, equivalent to saving two full-time positions."
Don't just say "access volume increased"—say "high-frequency access of core brand assets supported 8 major marketing campaigns throughout the year, directly contributing 15% GMV growth."
Example: "Recommend adding AI smart tagging functionality in 2025 to further improve asset search efficiency by 30%."
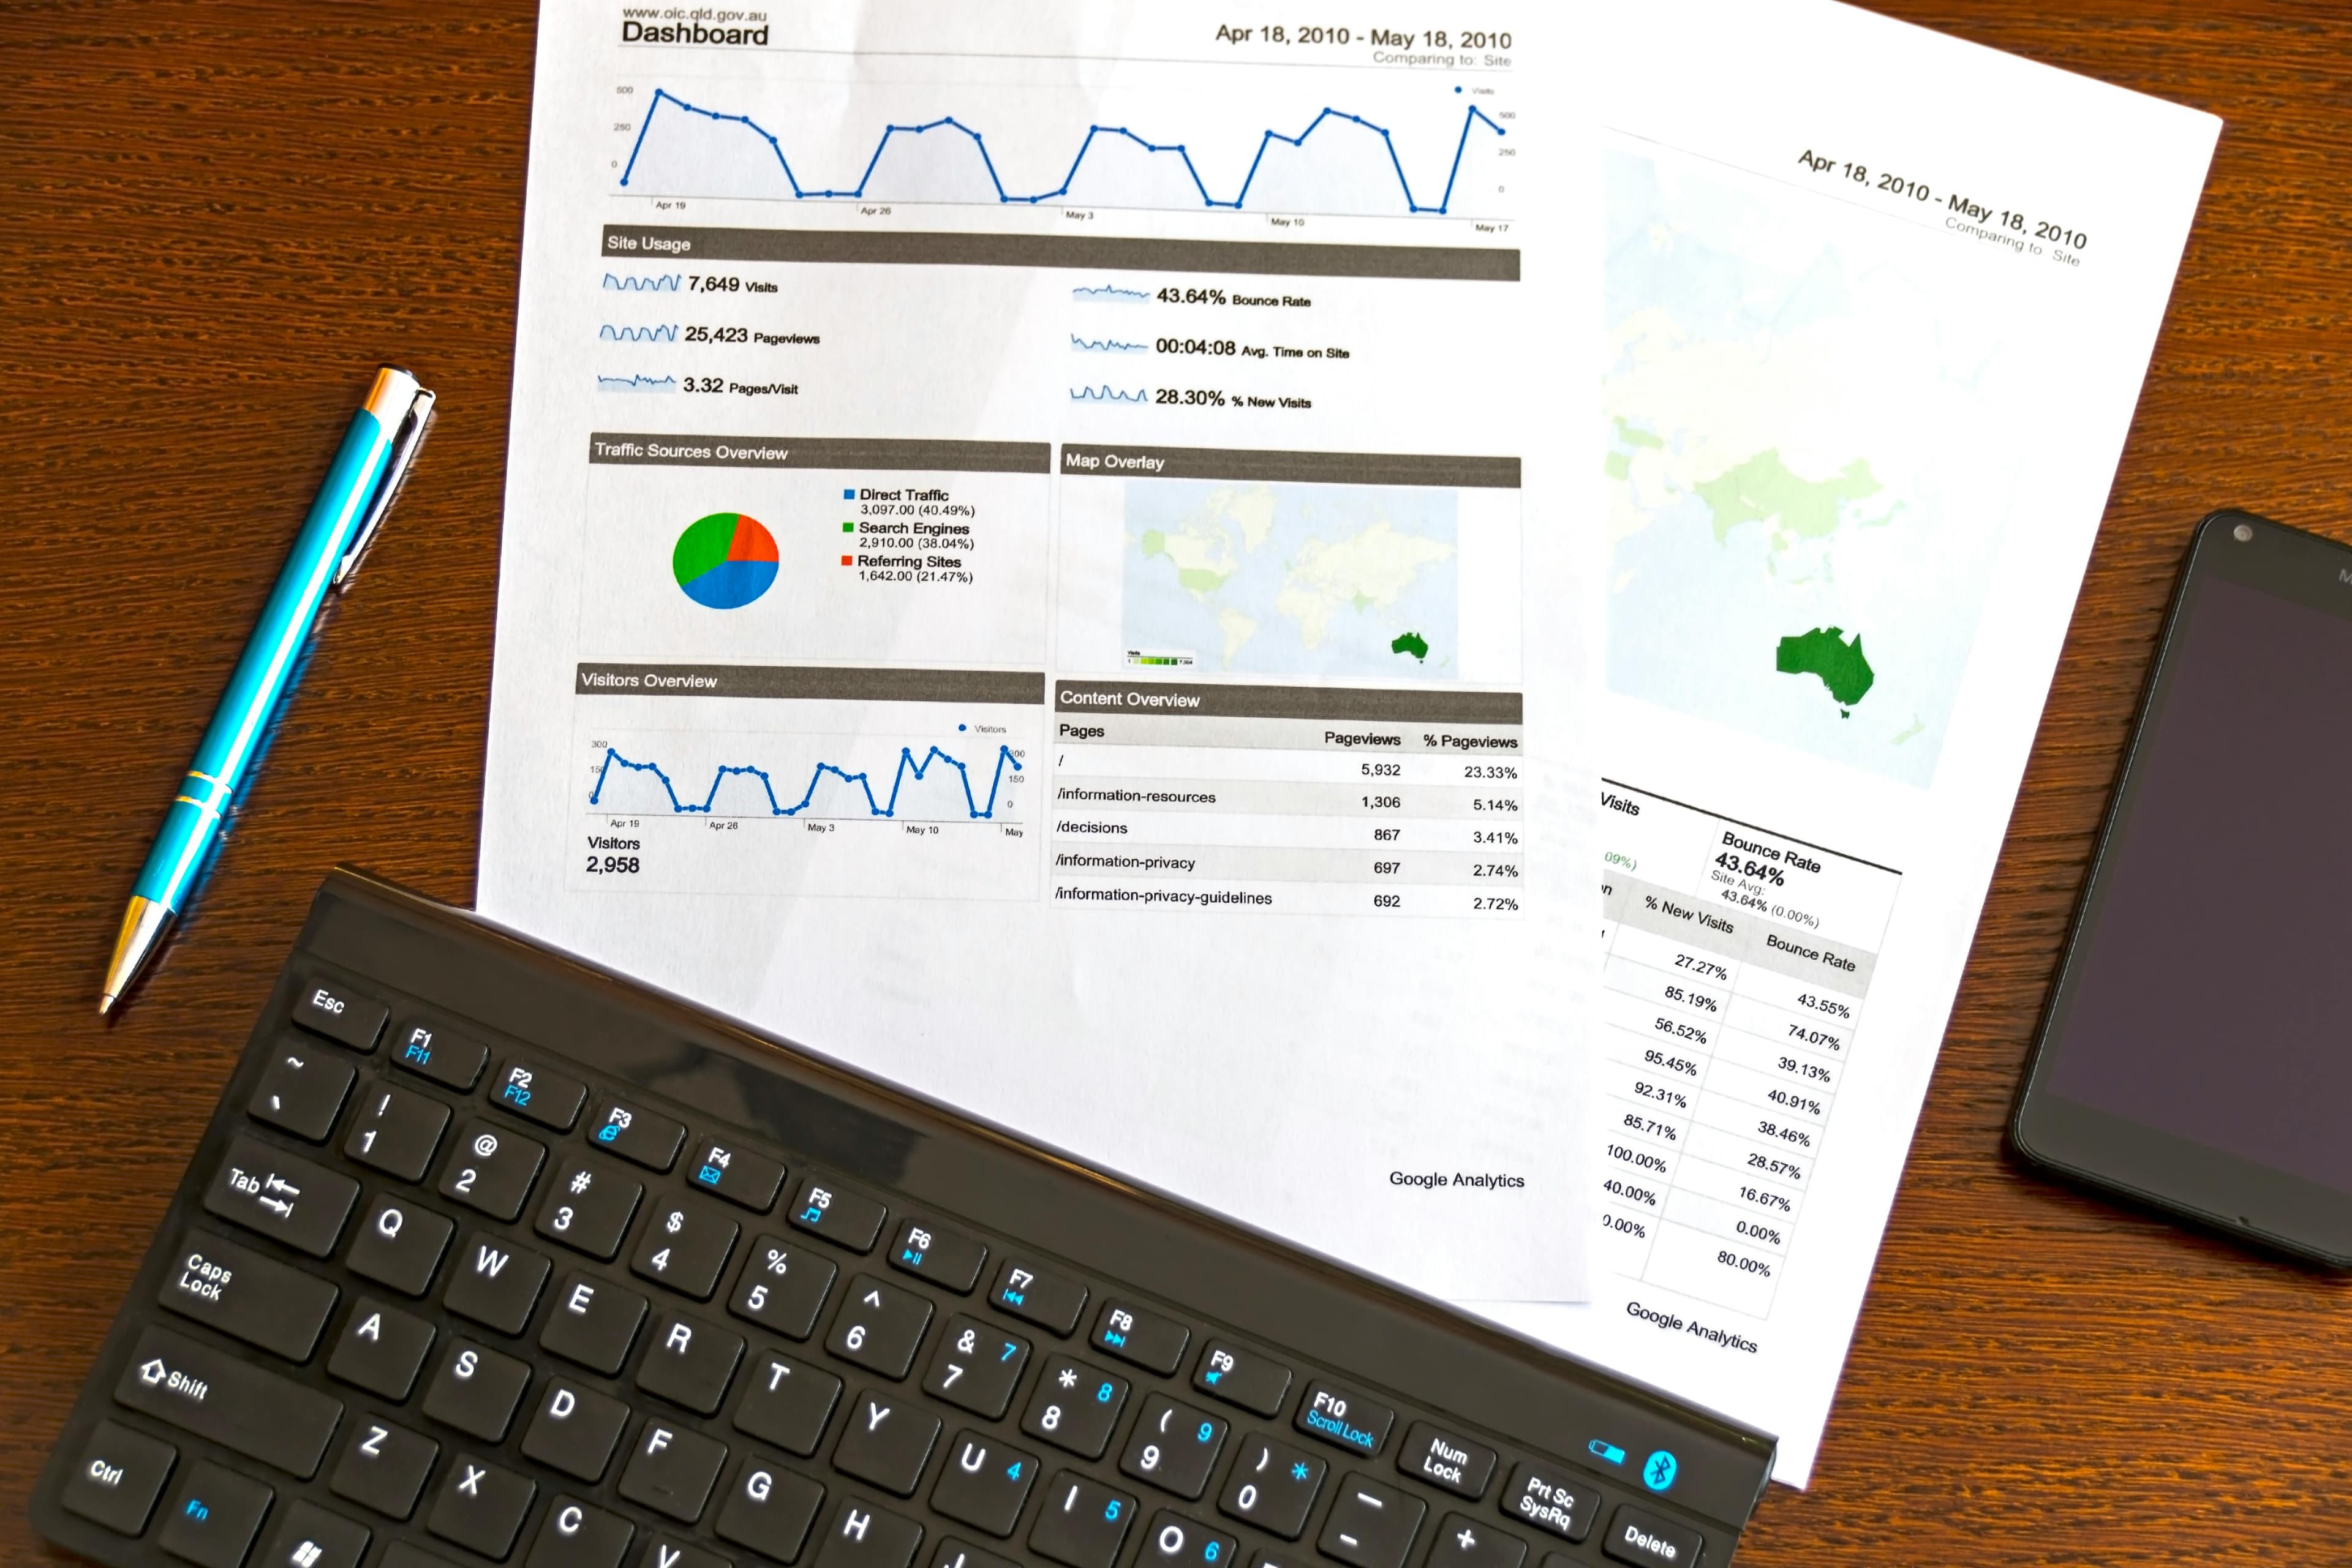
With MuseDAM data analytics, these metrics are available at one click, sparing teams from lengthy manual compilation.
Management cares not about "how many features were used," but rather:
Value translation example: "Reduced approval time saves the design team 80 hours monthly, equivalent to annual savings of approximately $20,000 in labor costs."
Value translation example: "Prevented one brand crisis from asset leakage, estimated to save at least $70,000 in PR costs."
When data speaks ROI language, it truly moves budget decision-makers.
An excellent annual report isn't just number stacking—it makes data "speak":
Use line charts to show "approval time gradually declining from 72 hours at year start to 8 hours at year end," letting management see sustained value release from the system.
Use bar charts comparing "rework frequency before and after DAM," for example:
Highlight frequently accessed core assets (brand logos, product hero images), helping management understand "which assets are business-critical," thereby guiding next year's asset investment strategy.
Use funnel charts to display "upload to final publication" process efficiency gains, such as:
This way, even flipping through just a few chart pages, management intuitively grasps DAM value.
An international fashion brand's design team once needed two weeks at year-end to prepare reports, searching files, sorting data. Team members worked overtime daily, piecing together information from folders, emails, and chat logs, with the final report still full of gaps.
After implementing MuseDAM, report generation cycle shortened to 3 days:
Data became more complete, presentation more intuitive. The Creative Director used this report in budget meetings to successfully secure approval for adding two designers next year.
After navigating Singles' Day, Black Friday, and Christmas promotions, a cross-border e-commerce team's Marketing Director needed to prove to the CEO that "the DAM system directly supported peak season sales."
Through the MuseDAM annual report, he demonstrated:
This report not only showed the CEO DAM value but won budget approval for expanding the overseas operations team next year.
A beauty brand's marketing team tracked global store asset distribution via DAM reporting, preventing brand risk from regional misuse of outdated versions.
The report showed:
These scenarios transform "reports" from mere PowerPoints into tangible business value leadership can see.
Core advantages of DAM reports:
👉 Learn more about MuseDAM data analytics
For quick implementation, reference this workflow:
Use DAM's data analytics features to export key metrics: asset access frequency, sharing rates, approval duration, top 20 most-used assets, department collaboration efficiency data, version error rates, permission access logs
Use trend charts, comparison charts, and heat maps to transform data into visual stories executives understand at a glance:
Convert efficiency and security data into ROI language:
Such a report not only completes the summary but helps teams win next year's resources in budget meetings.
Here's a directly applicable annual DAM report template:
This template satisfies management decision-making needs while providing strong support for securing next year's resources.
Weekly/monthly reports lean toward operational reviews, while annual reports are strategic-level summaries showcasing overall value and ROI, used for budget decisions and resource allocation.
Absolutely. MuseDAM has built-in data statistics enabling non-specialists to quickly generate complete reports. The system automatically tracks key metrics without manual compilation.
Moderate inclusion is recommended, such as labor savings and reduced outsourcing costs, but the focus should remain on efficiency, security, and business growth. Financial metrics are one form of value translation but shouldn't overshadow core content.
Combine cross-department scenarios. For example:
The key is replacing technical language with business language. Don't say "system access volume increased 28%"—say "high-frequency access of core assets supported 8 major marketing campaigns throughout the year, directly contributing 15% GMV growth."
Chat with us to discover why leading brands choose MuseDAM to upgrade their digital asset management.
Accuracy
Prone to omissions/errors |
System-recorded, highly precise |
Visualization | Basic Excel charts | Multi-dimensional interactive dashboards |
Value Presentation | Descriptive language | ROI-quantified metrics |
Time Cost | 1-2 weeks | 2-3 days |